Jump to section:
Type both inequalities
Type each inequality in Desmos.
The shaded overlap is the solution.
A point on a solid boundary line works.
One point at a time
Enter one point at a time. Turn on the label.
As soon as one point does not work, move on to the next table.
The first point can work when the next point does not.
A table represents the system when every point works.
Example
Which table represents the system?
y ≥ 12x − 1
y ≤ −13x + 4
A
| x | y |
|---|---|
| 0 | 6 |
| 2 | 2 |
| 4 | 1 |
| 6 | 2 |
B
| x | y |
|---|---|
| 0 | 1 |
| 2 | 2 |
| 4 | 2 |
| 6 | 2 |
C
| x | y |
|---|---|
| 0 | 1 |
| 2 | 5 |
| 4 | 2 |
| 6 | 2 |
D
| x | y |
|---|---|
| 0 | 0 |
| 2 | 2 |
| 4 | 2 |
| 8 | 2 |
In Desmos, type
y ≥ 12x − 1
y ≤ −13x + 4
Enter one point at a time. Turn on the label. As soon as one point does not work, move on to the next table.
Table A: (0, 6) does not work. Move on.
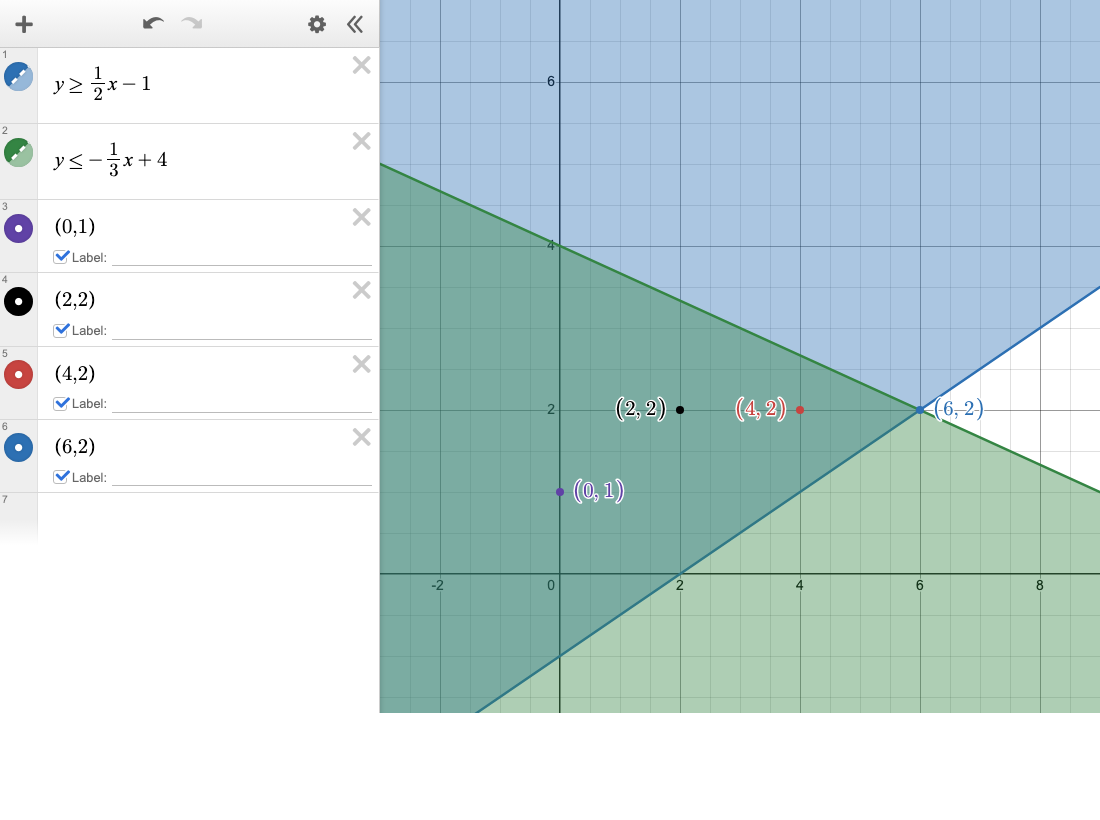
Every point in table B works: (0, 1), (2, 2), (4, 2), and (6, 2).
Table C: (0, 1) works. (2, 5) does not. Move on.
Table D: (0, 0), (2, 2), and (4, 2) work. (8, 2) does not. Move on.
A table represents the system when every point works.
Answer: B
Together
Work these three in a session. Enter one point at a time in Desmos.
Which table represents the system?
y ≥ 23x − 1
y ≤ −13x + 5
A
| x | y |
|---|---|
| −3 | 0 |
| 0 | 2 |
| 3 | 2 |
| 6 | 3 |
B
| x | y |
|---|---|
| 0 | 2 |
| 3 | 6 |
| 6 | 3 |
| −3 | 0 |
C
| x | y |
|---|---|
| 0 | 1 |
| 3 | 2 |
| 6 | 3 |
| 9 | 3 |
D
| x | y |
|---|---|
| 0 | −3 |
| 3 | 2 |
| 6 | 3 |
| −3 | 1 |
Show Answer
In Desmos, type
y ≥ 23x − 1
y ≤ −13x + 5
Enter one point at a time. Turn on the label. As soon as one point does not work, move on to the next table.
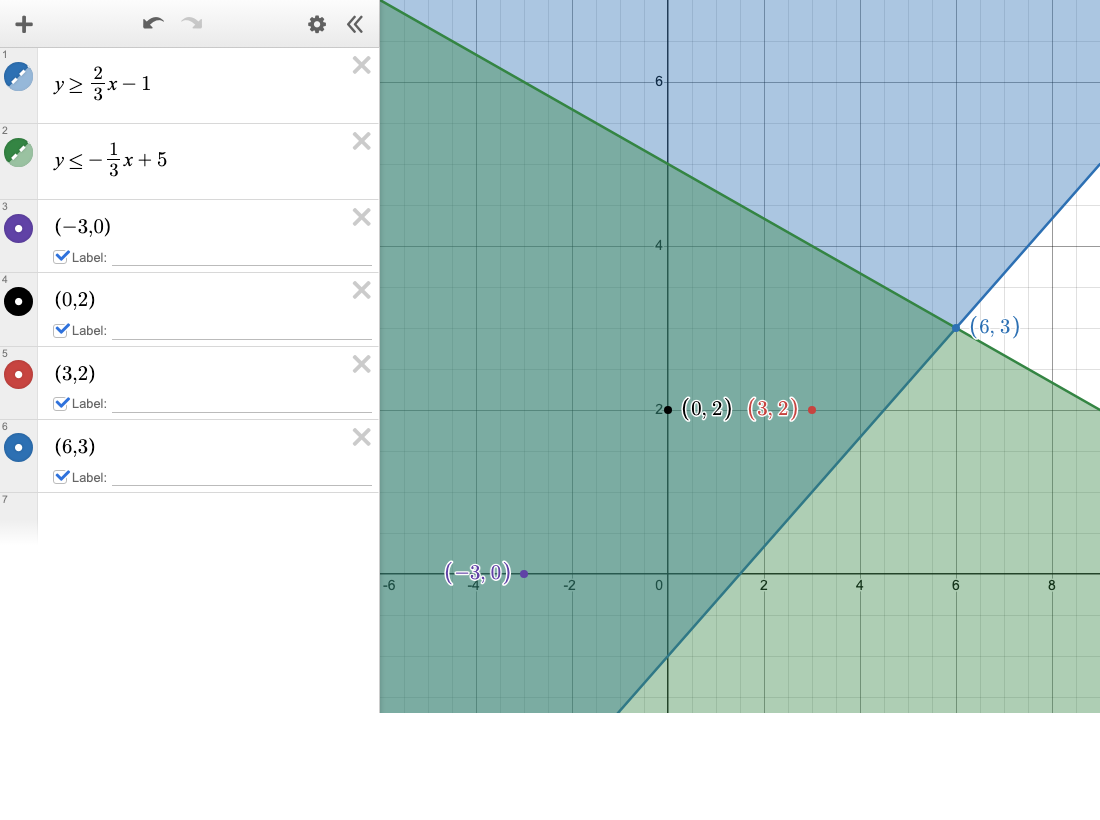
Every point in table A works: (−3, 0), (0, 2), (3, 2), and (6, 3).
Table B: (0, 2) works. (3, 6) does not. Move on.
Table C: (0, 1), (3, 2), and (6, 3) work. (9, 3) does not. Move on.
Table D: (0, −3) does not work. Move on.
A table represents the system when every point works.
Answer: A
Which table represents the system?
y ≥ −34x − 1
y ≤ 14x + 3
A
| x | y |
|---|---|
| 0 | 5 |
| 4 | 0 |
| 8 | −1 |
| −4 | 2 |
B
| x | y |
|---|---|
| 0 | 1 |
| 4 | 6 |
| 8 | 0 |
| −4 | 2 |
C
| x | y |
|---|---|
| −4 | 2 |
| 0 | 1 |
| 4 | 0 |
| 8 | −1 |
D
| x | y |
|---|---|
| 0 | 0 |
| 4 | 0 |
| 8 | −1 |
| 4 | 6 |
Show Answer
In Desmos, type
y ≥ −34x − 1
y ≤ 14x + 3
Enter one point at a time. Turn on the label. As soon as one point does not work, move on to the next table.
Table A: (0, 5) does not work. Move on.
Table B: (0, 1) works. (4, 6) does not. Move on.
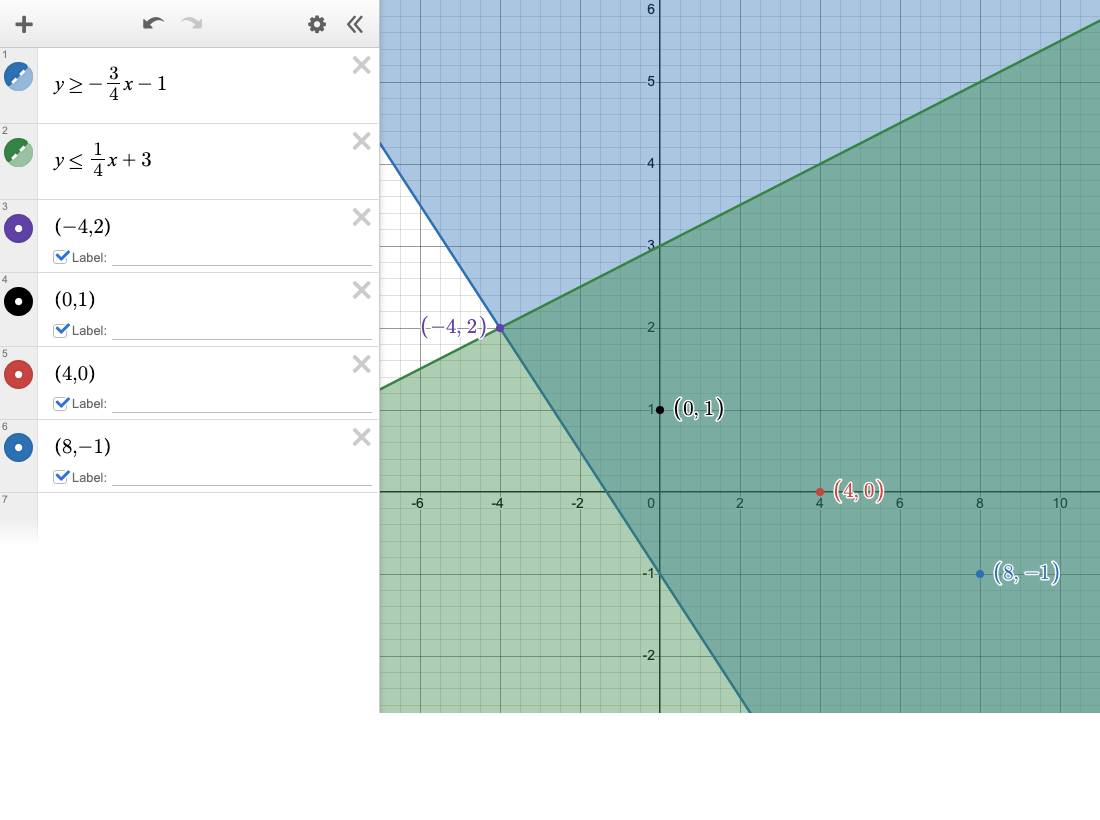
Every point in table C works: (−4, 2), (0, 1), (4, 0), and (8, −1).
Table D: (0, 0), (4, 0), and (8, −1) work. (4, 6) does not. Move on.
A table represents the system when every point works.
Answer: C
Which table represents the system?
y ≥ 14x − 2
y ≤ −12x + 4
A
| x | y |
|---|---|
| 0 | −4 |
| 4 | 0 |
| 8 | 0 |
| −4 | 0 |
B
| x | y |
|---|---|
| 0 | 1 |
| 4 | 4 |
| 8 | 0 |
| −4 | 1 |
C
| x | y |
|---|---|
| −4 | 0 |
| 0 | 1 |
| 4 | 0 |
| 12 | 0 |
D
| x | y |
|---|---|
| −4 | 0 |
| 0 | 1 |
| 4 | 0 |
| 8 | 0 |
Show Answer
In Desmos, type
y ≥ 14x − 2
y ≤ −12x + 4
Enter one point at a time. Turn on the label. As soon as one point does not work, move on to the next table.
Table A: (0, −4) does not work. Move on.
Table B: (0, 1) works. (4, 4) does not. Move on.
Table C: (−4, 0), (0, 1), and (4, 0) work. (12, 0) does not. Move on.
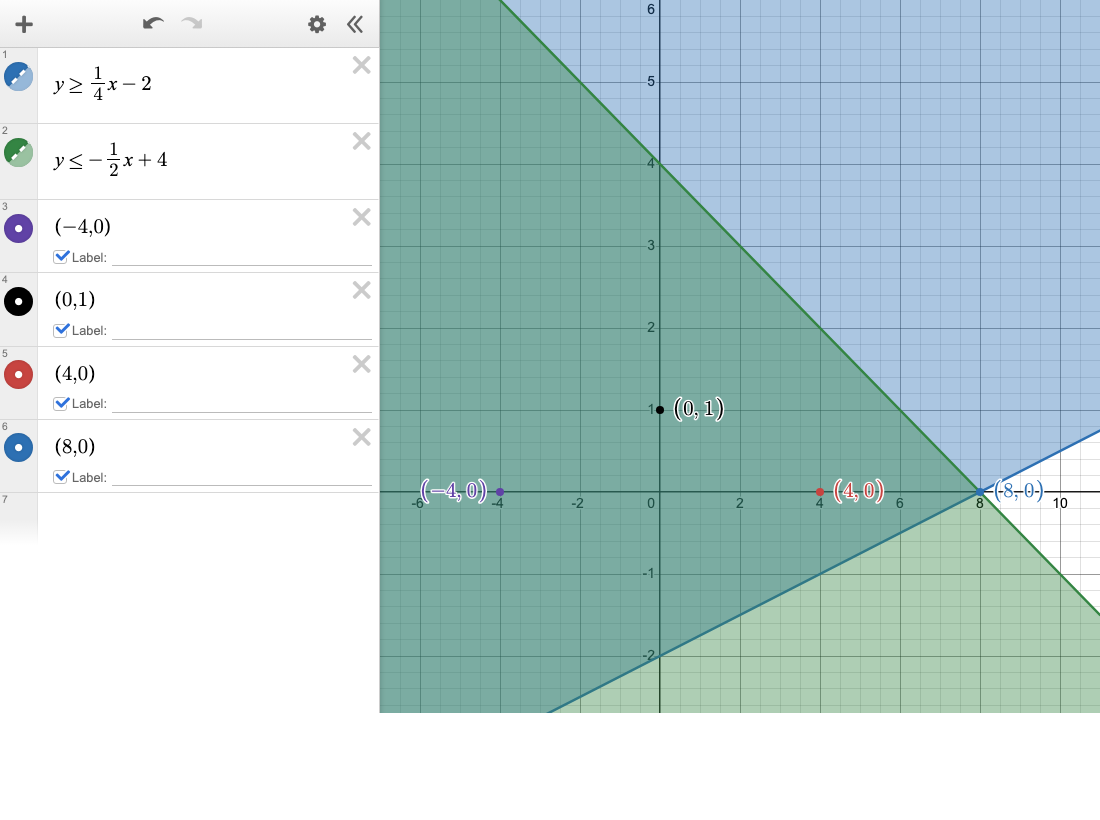
Every point in table D works: (−4, 0), (0, 1), (4, 0), and (8, 0).
A table represents the system when every point works.
Answer: D
Independent Practice
Try these five on your own. Enter one point at a time in Desmos.
Which table represents the system?
y ≥ −12x − 1
y ≤ 13x + 2
A
| x | y |
|---|---|
| 0 | 4 |
| 3 | 1 |
| 6 | 0 |
| −3 | 1 |
B
| x | y |
|---|---|
| −3 | 1 |
| 0 | 0 |
| 3 | 1 |
| 6 | 0 |
C
| x | y |
|---|---|
| 0 | 0 |
| 3 | 5 |
| 6 | 0 |
| −3 | 1 |
D
| x | y |
|---|---|
| 0 | 0 |
| 3 | 1 |
| 6 | 0 |
| −6 | 0 |
Show Answer
In Desmos, type
y ≥ −12x − 1
y ≤ 13x + 2
Enter one point at a time. Turn on the label. As soon as one point does not work, move on to the next table.
Table A: (0, 4) does not work. Move on.
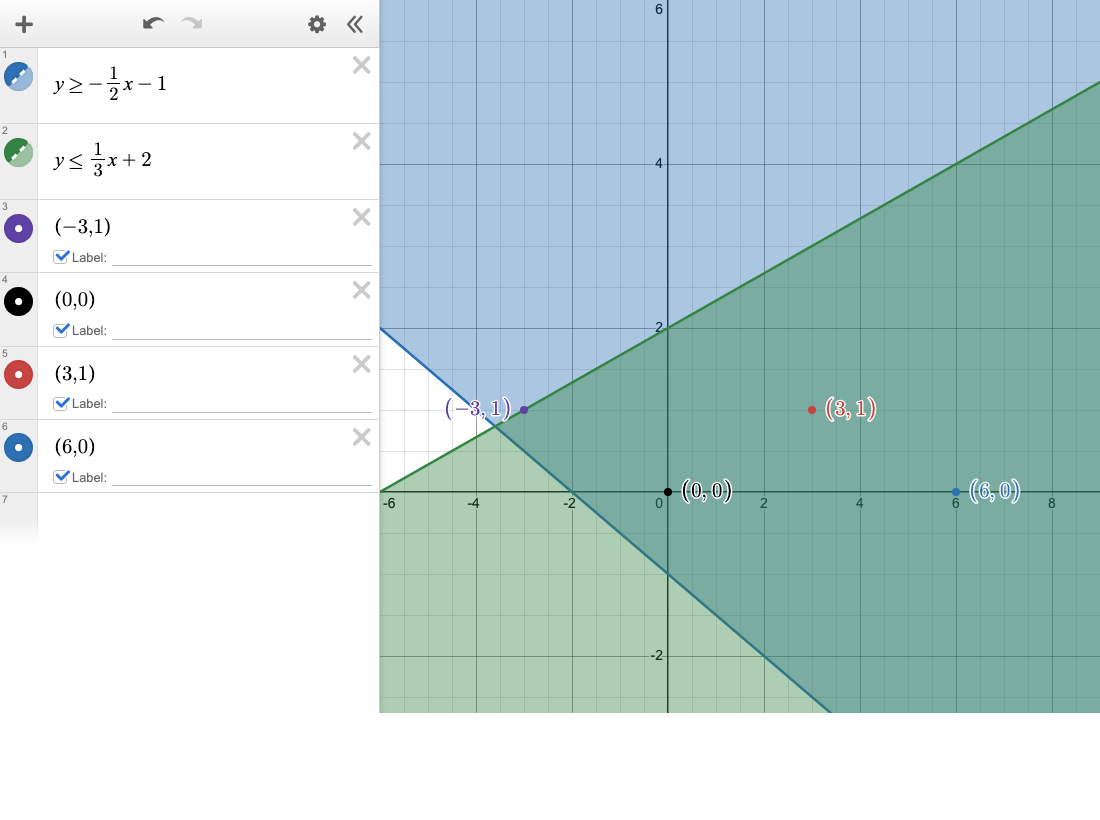
Every point in table B works: (−3, 1), (0, 0), (3, 1), and (6, 0).
Table C: (0, 0) works. (3, 5) does not. Move on.
Table D: (0, 0), (3, 1), and (6, 0) work. (−6, 0) does not. Move on.
A table represents the system when every point works.
Answer: B
Which table represents the system?
y ≥ 32x − 2
y ≤ −12x + 4
A
| x | y |
|---|---|
| 0 | −4 |
| 1 | 2 |
| 2 | 2 |
| −2 | 0 |
B
| x | y |
|---|---|
| 0 | 1 |
| 2 | 5 |
| 1 | 2 |
| −2 | 0 |
C
| x | y |
|---|---|
| 0 | 1 |
| −2 | 2 |
| 2 | 2 |
| 4 | 2 |
D
| x | y |
|---|---|
| −4 | 0 |
| −2 | 2 |
| 0 | 1 |
| 2 | 2 |
Show Answer
In Desmos, type
y ≥ 32x − 2
y ≤ −12x + 4
Enter one point at a time. Turn on the label. As soon as one point does not work, move on to the next table.
Table A: (0, −4) does not work. Move on.
Table B: (0, 1) works. (2, 5) does not. Move on.
Table C: (0, 1), (−2, 2), and (2, 2) work. (4, 2) does not. Move on.
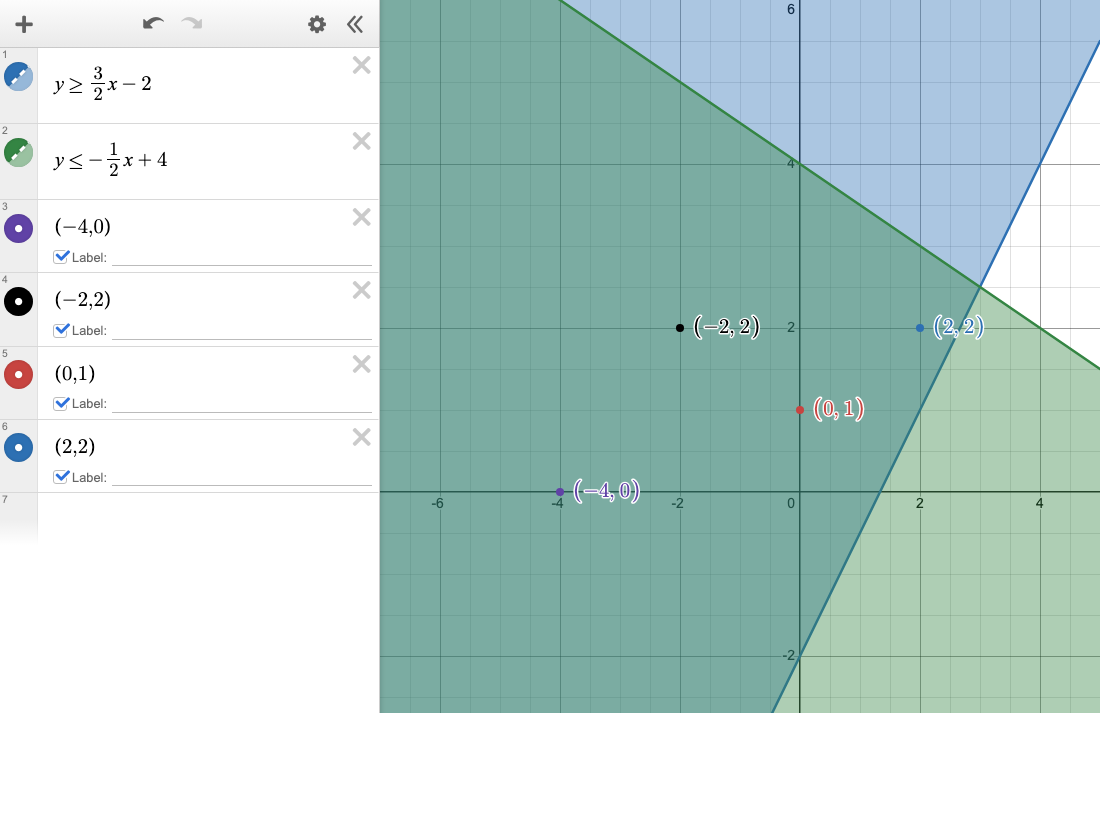
Every point in table D works: (−4, 0), (−2, 2), (0, 1), and (2, 2).
A table represents the system when every point works.
Answer: D
Which table represents the system?
y ≥ 15x − 1
y ≤ −25x + 4
A
| x | y |
|---|---|
| −5 | 1 |
| 0 | 2 |
| 2 | 0 |
| 5 | 1 |
B
| x | y |
|---|---|
| 0 | 2 |
| 5 | 4 |
| −5 | 1 |
| 5 | 0 |
C
| x | y |
|---|---|
| −5 | 1 |
| 0 | 2 |
| 5 | 1 |
| 10 | 1 |
D
| x | y |
|---|---|
| 0 | 6 |
| 2 | 0 |
| 5 | 1 |
| −5 | 0 |
Show Answer
In Desmos, type
y ≥ 15x − 1
y ≤ −25x + 4
Enter one point at a time. Turn on the label. As soon as one point does not work, move on to the next table.
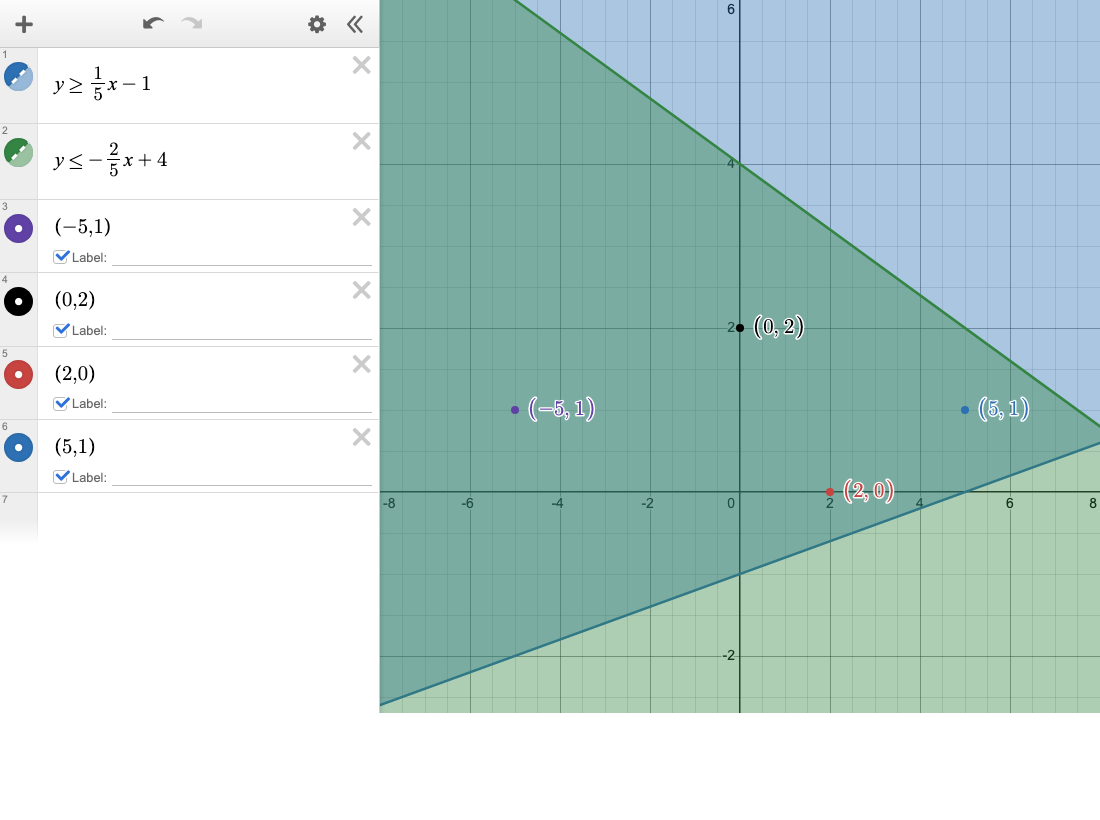
Every point in table A works: (−5, 1), (0, 2), (2, 0), and (5, 1).
Table B: (0, 2) works. (5, 4) does not. Move on.
Table C: (−5, 1), (0, 2), and (5, 1) work. (10, 1) does not. Move on.
Table D: (0, 6) does not work. Move on.
A table represents the system when every point works.
Answer: A
Which table represents the system?
y ≥ −23x + 1
y ≤ 13x + 3
A
| x | y |
|---|---|
| 0 | 0 |
| 3 | 0 |
| 6 | 2 |
| 9 | 1 |
B
| x | y |
|---|---|
| 0 | 2 |
| 3 | 6 |
| 6 | 2 |
| 9 | 1 |
C
| x | y |
|---|---|
| 0 | 2 |
| 3 | 0 |
| 6 | 2 |
| 9 | 1 |
D
| x | y |
|---|---|
| 0 | 2 |
| 3 | 0 |
| 6 | 2 |
| −3 | 2 |
Show Answer
In Desmos, type
y ≥ −23x + 1
y ≤ 13x + 3
Enter one point at a time. Turn on the label. As soon as one point does not work, move on to the next table.
Table A: (0, 0) does not work. Move on.
Table B: (0, 2) works. (3, 6) does not. Move on.
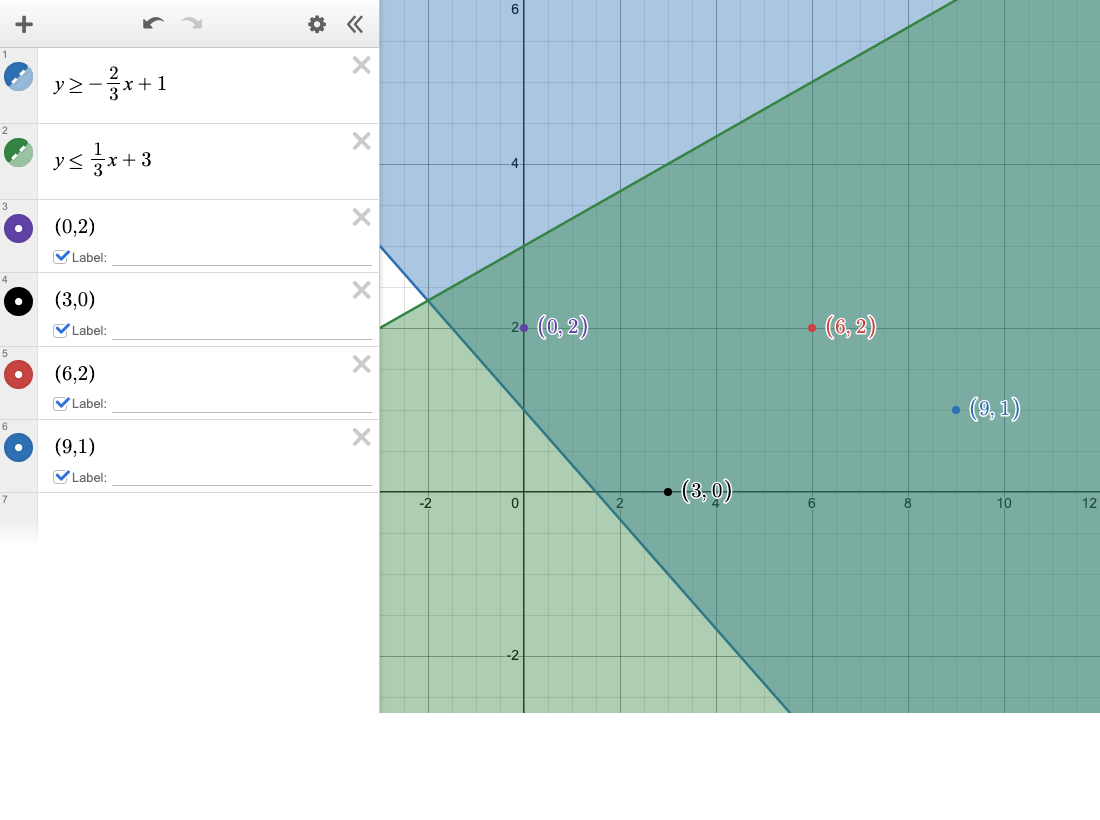
Every point in table C works: (0, 2), (3, 0), (6, 2), and (9, 1).
Table D: (0, 2), (3, 0), and (6, 2) work. (−3, 2) does not. Move on.
A table represents the system when every point works.
Answer: C
Which table represents the system?
y ≥ 25x − 2
y ≤ −15x + 3
A
| x | y |
|---|---|
| 0 | 5 |
| 2 | 0 |
| 5 | 1 |
| −5 | 1 |
B
| x | y |
|---|---|
| −5 | −2 |
| 0 | −1 |
| 2 | 1 |
| 5 | 0 |
C
| x | y |
|---|---|
| 0 | 2 |
| 5 | 4 |
| 2 | 0 |
| −5 | 1 |
D
| x | y |
|---|---|
| −5 | 1 |
| 0 | 2 |
| 5 | 1 |
| 10 | 2 |
Show Answer
In Desmos, type
y ≥ 25x − 2
y ≤ −15x + 3
Enter one point at a time. Turn on the label. As soon as one point does not work, move on to the next table.
Table A: (0, 5) does not work. Move on.
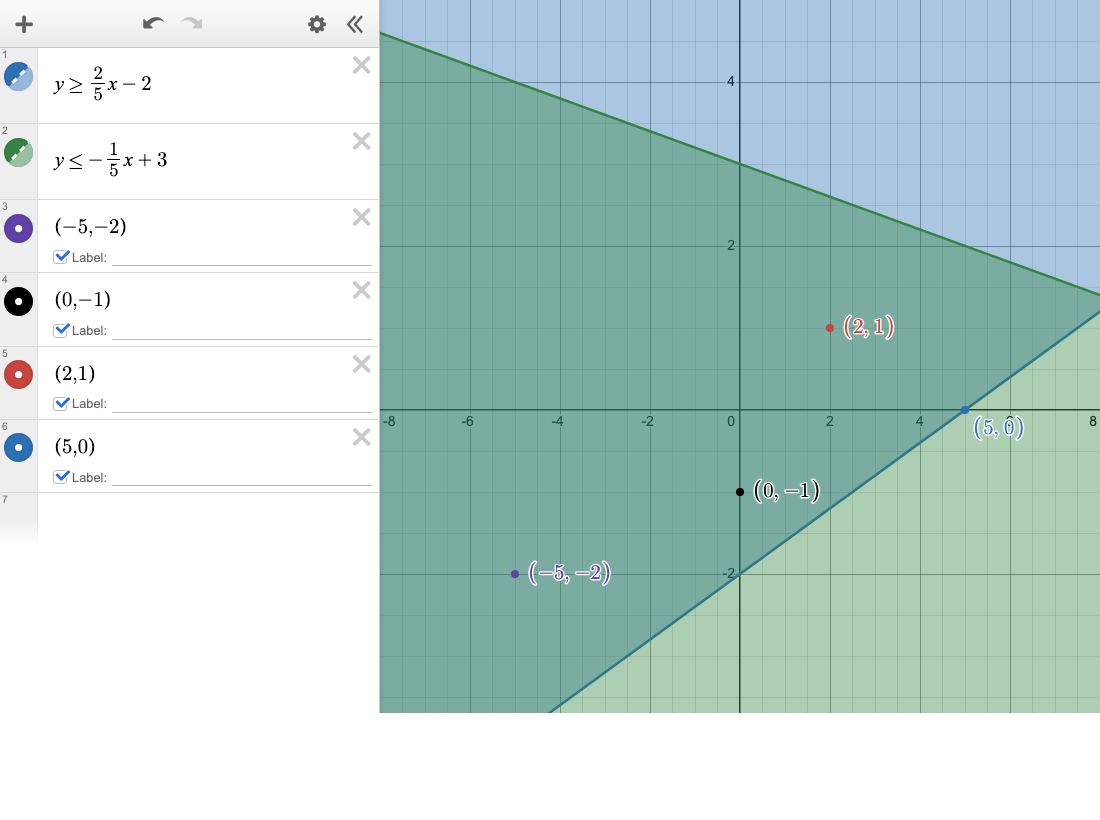
Every point in table B works: (−5, −2), (0, −1), (2, 1), and (5, 0).
Table C: (0, 2) works. (5, 4) does not. Move on.
Table D: (−5, 1), (0, 2), and (5, 1) work. (10, 2) does not. Move on.
A table represents the system when every point works.
Answer: B
Want to practice this together?
Book a Session with Amy